Join Now Member Login

One Dot

What caravan and camping is worth to Australia

One Dot

This dot is one caravan.  Follow it, and you can see how much of Australia's travel, spending and regional economy rides with it.

Caravan Industry Association of Australia.  Scroll, and the dot travels the route marked across the screen.  Use the buttons on each card to compare, and point at any dot to see what it stands for.

It enters the market

46,861

Before a new recreational vehicle can be supplied in Australia, it is entered on the national Register of Approved Vehicles.  In the 12 months to September 2026 there were 46,861 entries.

The industry is two halves of similar size.  In 2025, 23,963 vehicles were made in Australia and 23,244 caravan trailer units, worth $619.2 million, were internationally made.  Our dot could be either.

Show the dots as

It joins the fleet

972,070

Our caravan becomes one of 972,070 registered recreational vehicles, counted on 31 January 2026.  The fleet grew by 34,369 in a year, or 3.7 per cent.

A year earlier, at 937,701, the fleet was close to the number of motorcycles on Australian roads, more than twice the number of heavy rigid trucks and seven times the number of articulated trucks.

Show the dots as

It is one for every 11 households

1 for every 11

Australia has about 10.8 million households and 27.9 million people.  That is one registered recreational vehicle for every 11 households, or one for every 29 people.  Put another way, there are nine vehicles for every 100 households.

The rate is highest in Tasmania, with one for every 18 people, followed by Queensland with one for every 22 and Western Australia with one for every 23.

Show the dots as

It lives in the regions

The eight postcodes with the most registered recreational vehicles are all regional or coastal centres, and seven of them are in Queensland.  Bundaberg has the most, with 7,166.

The fleet is also young.  Of vehicles with a recorded year of manufacture, 46 per cent were built in 2016 or later.

It takes a trip

17.3 million

Australians took 113 million domestic overnight trips in 2025.  Caravan and camping accounted for 17.3 million of them.  That is 15 per cent, or about one trip in every seven.

Most of those trips, 87 per cent, were in regional areas.

Show the dots as

It stays

57.9 million

Caravan and camping travellers spent 57.9 million nights away in 2025.  That is 15 per cent of the 381.2 million nights Australians spent on domestic overnight trips.

Show the dots as

It spends

$12.6 billion

Those travellers spent $12.6 billion, about 12 per cent of all domestic overnight travel spending ($106.7 billion).

The average caravan and camping trip cost $728, compared with $945 across all domestic overnight trips.  It takes a larger share of trips than of spending because it is a lower-cost way to travel.

Show the dots as

It pays for a site

$3.3 billion

Caravan parks earned $3.3 billion in revenue in 2025, up 7 per cent on the year before.  Cabins brought in $2.1 billion, powered sites $1.2 billion and unpowered sites $70.5 million.

It keeps people in work

168,665 jobs

Economic modelling by BDO for the association estimated that caravan parks and the spending of their visitors supported 168,665 full-time equivalent jobs in 2020-21.

Of those, 57,603 were direct: 11,269 in the parks themselves and 46,334 in the transport, food, retail and tourism businesses where park visitors spend.  For every job in a caravan park, about four more are supported directly in other businesses.

Show the dots as

It adds to gross domestic product

$20.9 billion

The same study put the contribution of caravan parks and their visitors to gross domestic product at $20.9 billion in 2020-21, of which $6.2 billion was direct.  More than four fifths came from what visitors spend outside the park gate.

Every $1 of direct output added $1.53 to gross domestic product.  The direct contribution was equivalent to about a fifth of Australia's direct tourism gross domestic product that year ($32.4 billion).

Show the dots as

It adds up

$27.1 billion

Caravan parks, manufacturing and trade, and visitor spending together have an economic impact of $27.1 billion on the Australian economy each year.

For a sense of scale, the gross value of all Australian farm production was $82.4 billion in 2023-24, and tourism's direct contribution to gross domestic product was $81.1 billion in 2024-25.  These are different measures and are shown for scale only.

Show the dots as

It goes again

72%

Household budgets are tight.  Even so, 72 per cent of caravan and camping consumers surveyed in August 2026 plan a trip in the next 12 months.

One dot

One caravan, at the end of its route.  Australian-made or internationally made, registered, kept in a regional town, towed to another, parked for a few nights and paid for along the way.

Multiplied across the country, it is one in seven domestic overnight trips, tens of thousands of jobs and a $27.1 billion contribution to the economy.

Explore

Caravan and camping by state and territory

Choose a state or territory to see its share of the national fleet, trips, nights and visitor spending.  Each grid is 100 dots, and each dot is 1 per cent of the national total.

Data sources and method

Where the numbers come from

Every figure in this story, with its period and source

Rows with a green edge are comparison figures from other organisations.

FigureValuePeriodSource
Recreational vehicles entered on the Register of Approved Vehicles46,86112 months to September 2026Bureau of Infrastructure and Transport Research Economics; analysis by Caravan Industry Association of Australia (RV Production IQ, September 2026)
Of which towable, and motorised42,697 and 4,16412 months to September 2026As above
Recreational vehicles made in Australia23,9632025nemAustralasia, in State of Industry 2026
Internationally made caravan trailers and related components entering Australia, and their value23,244 units, $619.2 million2025Australian Bureau of Statistics, International Merchandise Trade, in State of Industry 2026
Registered recreational vehicles972,07031 January 2026Bureau of Infrastructure and Transport Research Economics, Road Vehicles Australia, customised data extract for Caravan Industry Association of Australia, 16 November 2026
Of which caravans, and campervans848,131 and 123,93931 January 2026As above, Table 1
Registered recreational vehicles a year earlier937,70131 January 2025Bureau of Infrastructure and Transport Research Economics, Road Vehicles Australia, January 2025 data
Registrations by state, by postcode and by year of manufactureSee story31 January 2026Customised data extract as above; states allocated by postcode range; analysis by Caravan Industry Association of Australia
Population of Australia, and of each state and territory27,921,15031 March 2026Australian Bureau of Statistics, National, state and territory population, March 2026
Projected households in Australia (Series II)10,787,60230 June 2026Australian Bureau of Statistics, Household and family projections, Australia, 2021 to 2046
Households, and people, for each registered recreational vehicle11.1 and 28.72026Calculated by Caravan Industry Association of Australia from the three rows above
Registered motorcycles982,06731 January 2025Bureau of Infrastructure and Transport Research Economics, Road Vehicles Australia, January 2025, Table 1
Registered heavy rigid trucks403,94631 January 2025As above
Registered articulated trucks128,38331 January 2025As above
Registered buses (light 55,716 and heavy 48,916)104,63231 January 2025As above; total calculated
Total registered motor vehicles22,305,34731 January 2025As above
Caravan and camping domestic overnight trips17.3 million2025Tourism Research Australia, in State of Industry 2026
Share of caravan and camping trips in regional areas87%2025As above
Caravan and camping nights57.9 million2025As above
Caravan and camping visitor expenditure, and average per trip$12.6 billion, $7282025As above
Trips, nights and expenditure by state, and top 10 regionsSee story2025As above, Table 7 and top 10 regions table
All domestic overnight trips113.0 million2025Austrade, Australia's visitor economy in 2025: Annual benchmark report (June 2026), from Tourism Research Australia data
All domestic visitor nights381.2 million2025As above
All domestic overnight spend, and average per trip$106.7 billion, $9452025As above
Caravan park revenue: total, cabins, powered sites, unpowered sites$3.3 billion; $2.1 billion; $1.2 billion; $70.5 million2025State of Industry 2026
Full-time equivalent jobs supported by caravan parks and their visitors: total, and direct168,665; 57,6032020-21BDO EconSearch, Economic Contribution of the Caravan Park Industry to Australia in 2020/21 (2022), Table 3-3
Direct full-time equivalent jobs: in caravan parks, and in businesses where visitors spend11,269; 46,3342020-21As above, Tables 3-1 and 3-2
Direct jobs counted as total jobs72,3432020-21As above, Table 3-3
Flow-on jobs by industrySee story2020-21As above, Table 3-3
Contribution to gross domestic product by caravan parks and their visitors: total, and direct$20.9 billion; $6.2 billion2020-21As above, Table 3-3
Gross domestic product added per $1 of direct output$1.532020-21As above
People employed in tourism in Australia507,0002020-21Australian Bureau of Statistics, Tourism Satellite Account, 2020-21
Direct tourism gross domestic product, Australia$32.4 billion2020-21As above
Annual economic impact of caravan and camping$27.1 billionAnnualState of Industry 2026
Gross value of Australian agricultural production$82.4 billion2023-24Australian Bureau of Agricultural and Resource Economics and Sciences, Snapshot of Australian Agriculture 2025
Direct tourism gross domestic product$81.1 billion2024-25Australian Bureau of Statistics, Tourism Satellite Account, 2024-25
Consumers planning a caravan or camping trip in the next 12 months72%August 2026Caravan and Camping Consumer Sentiment, September 2026, 679 consumers
Method and notes on reading the figures

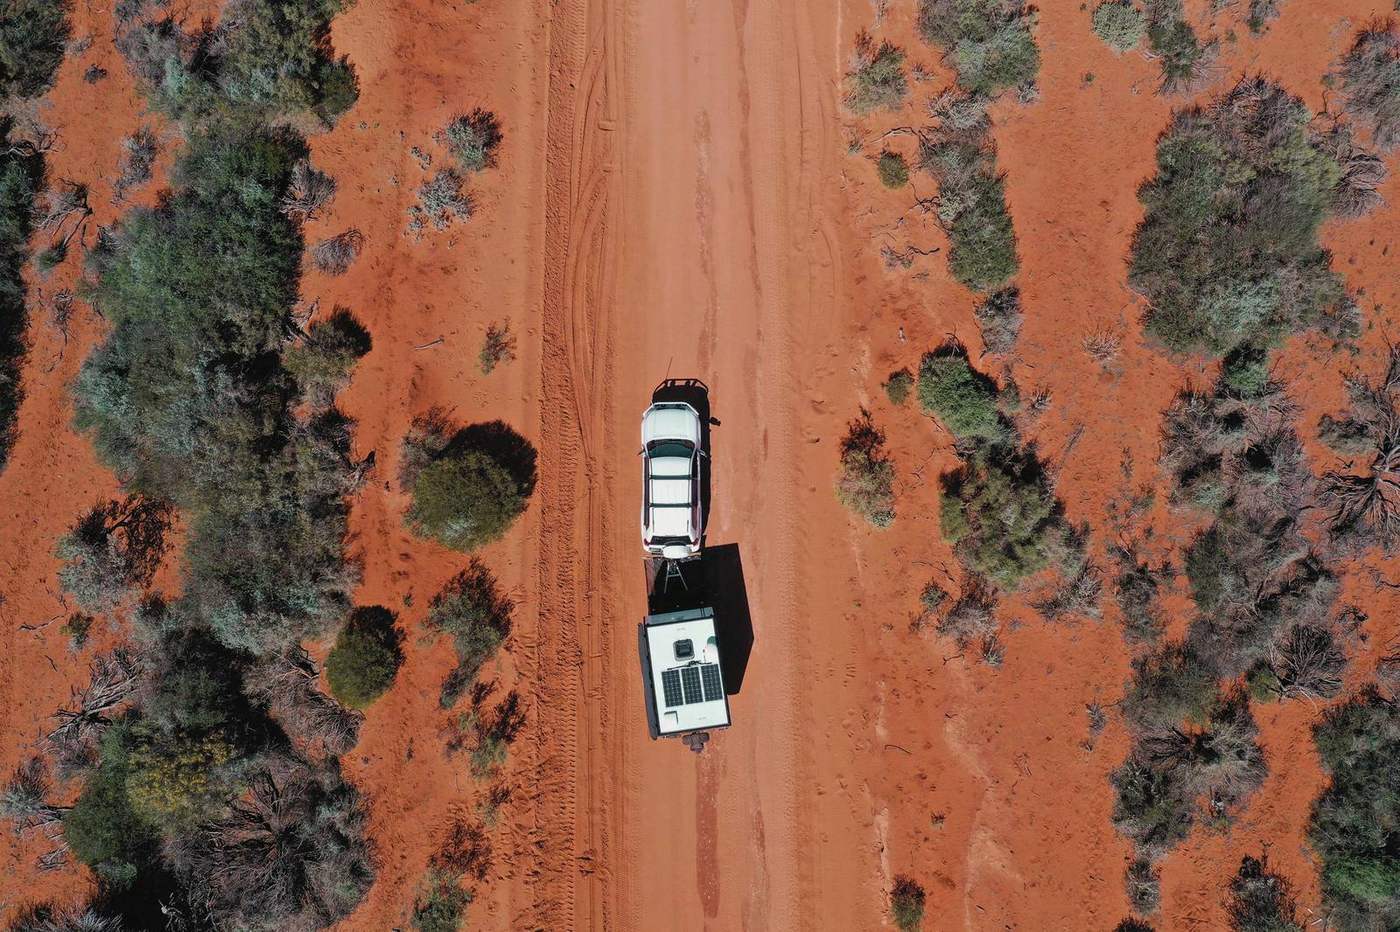
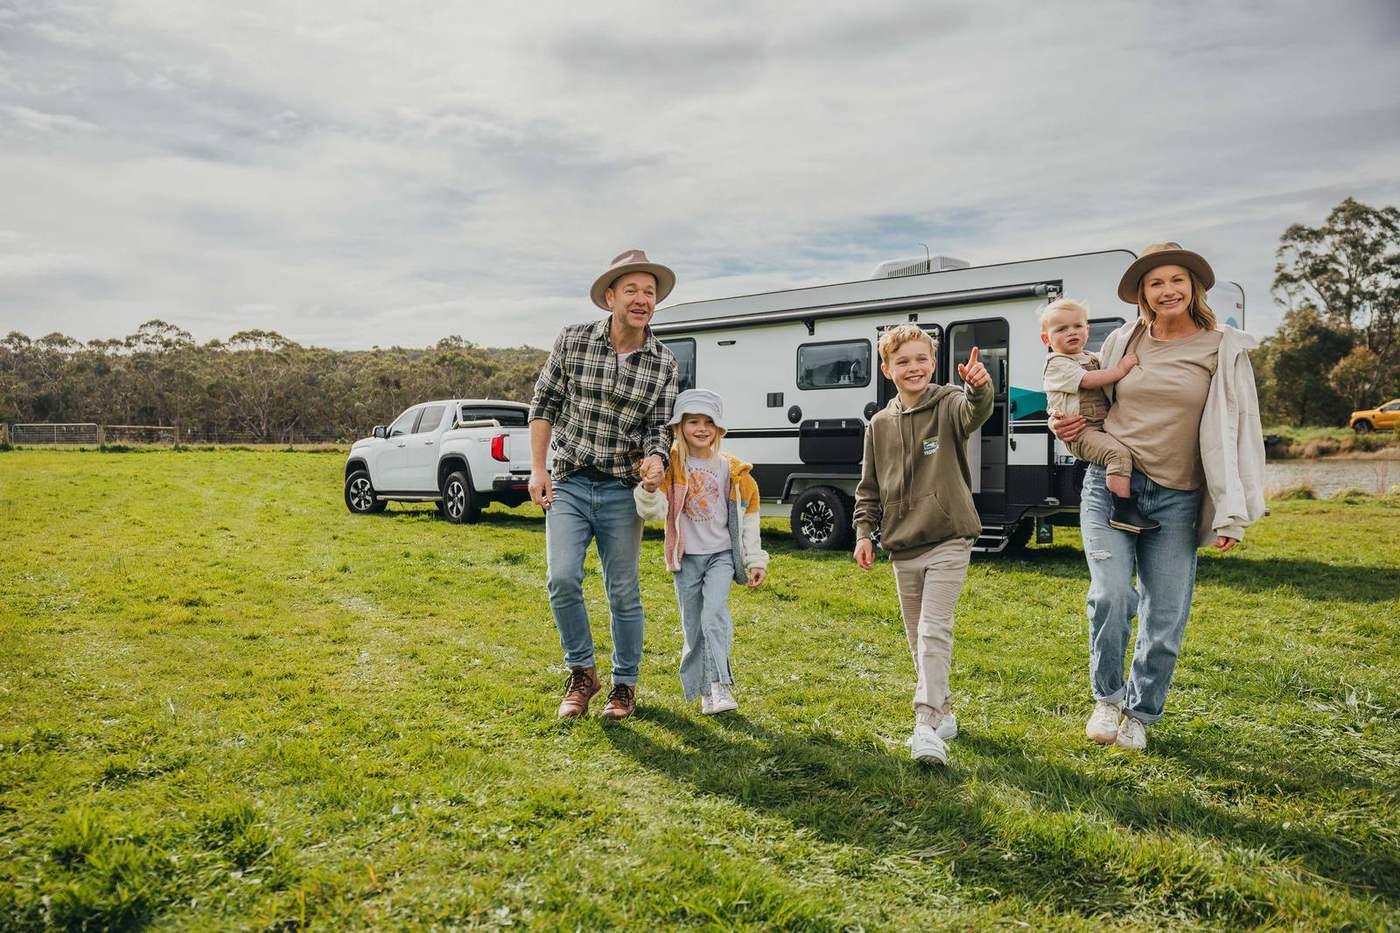
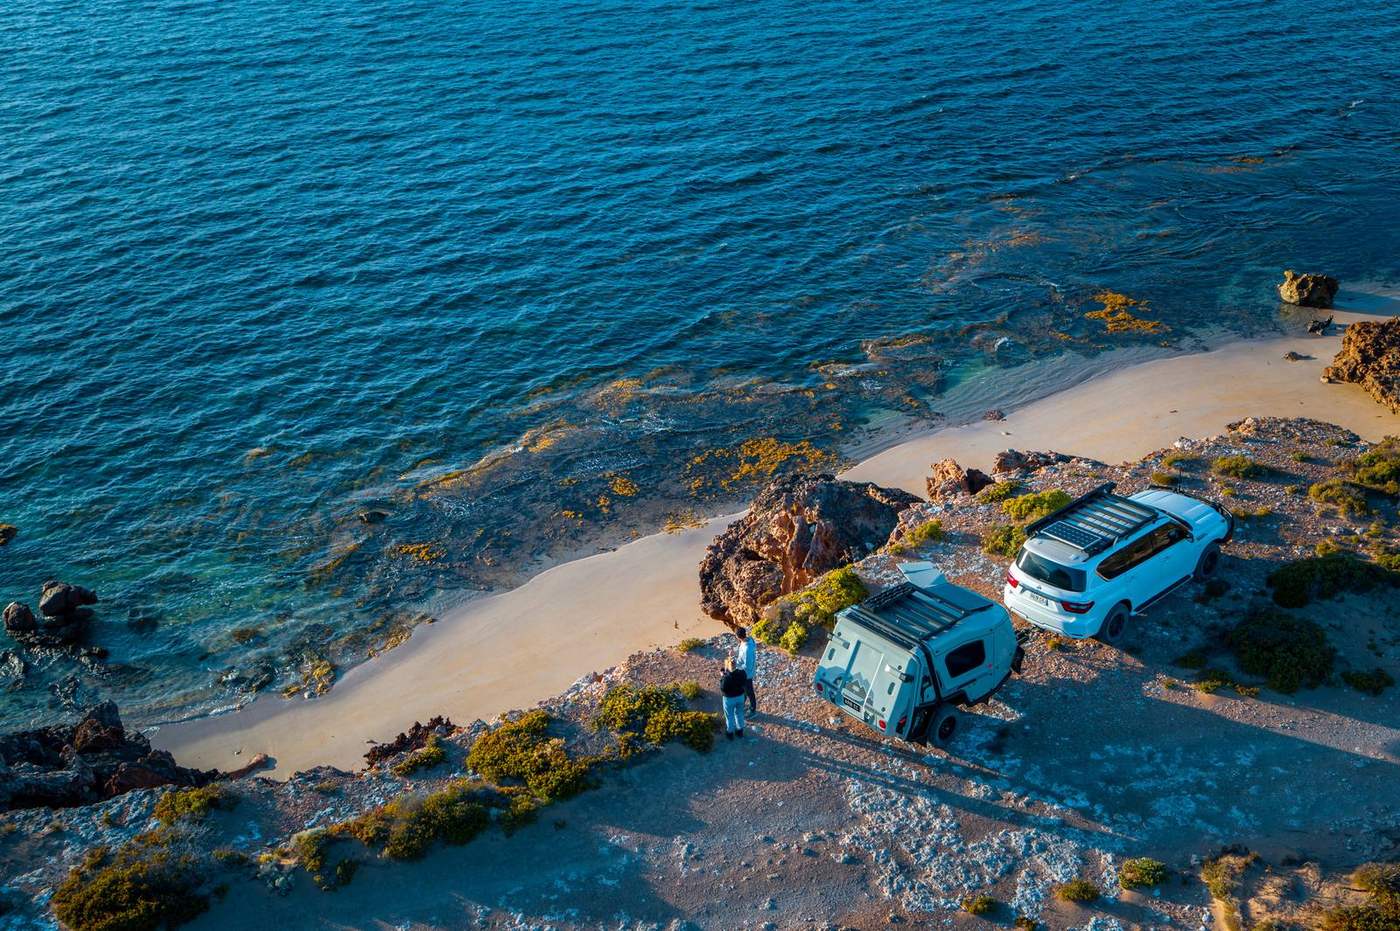
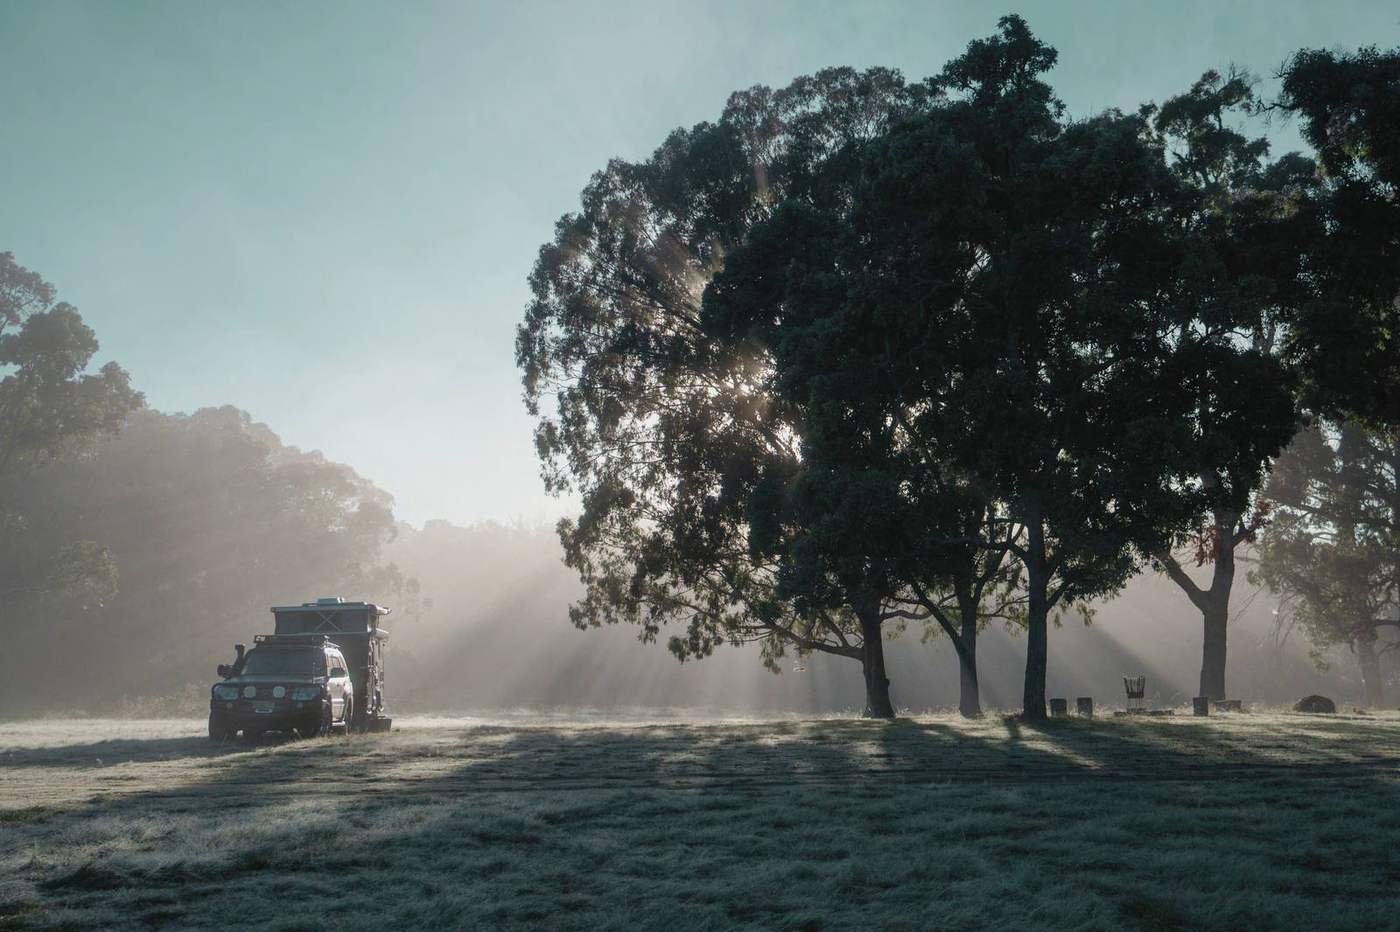
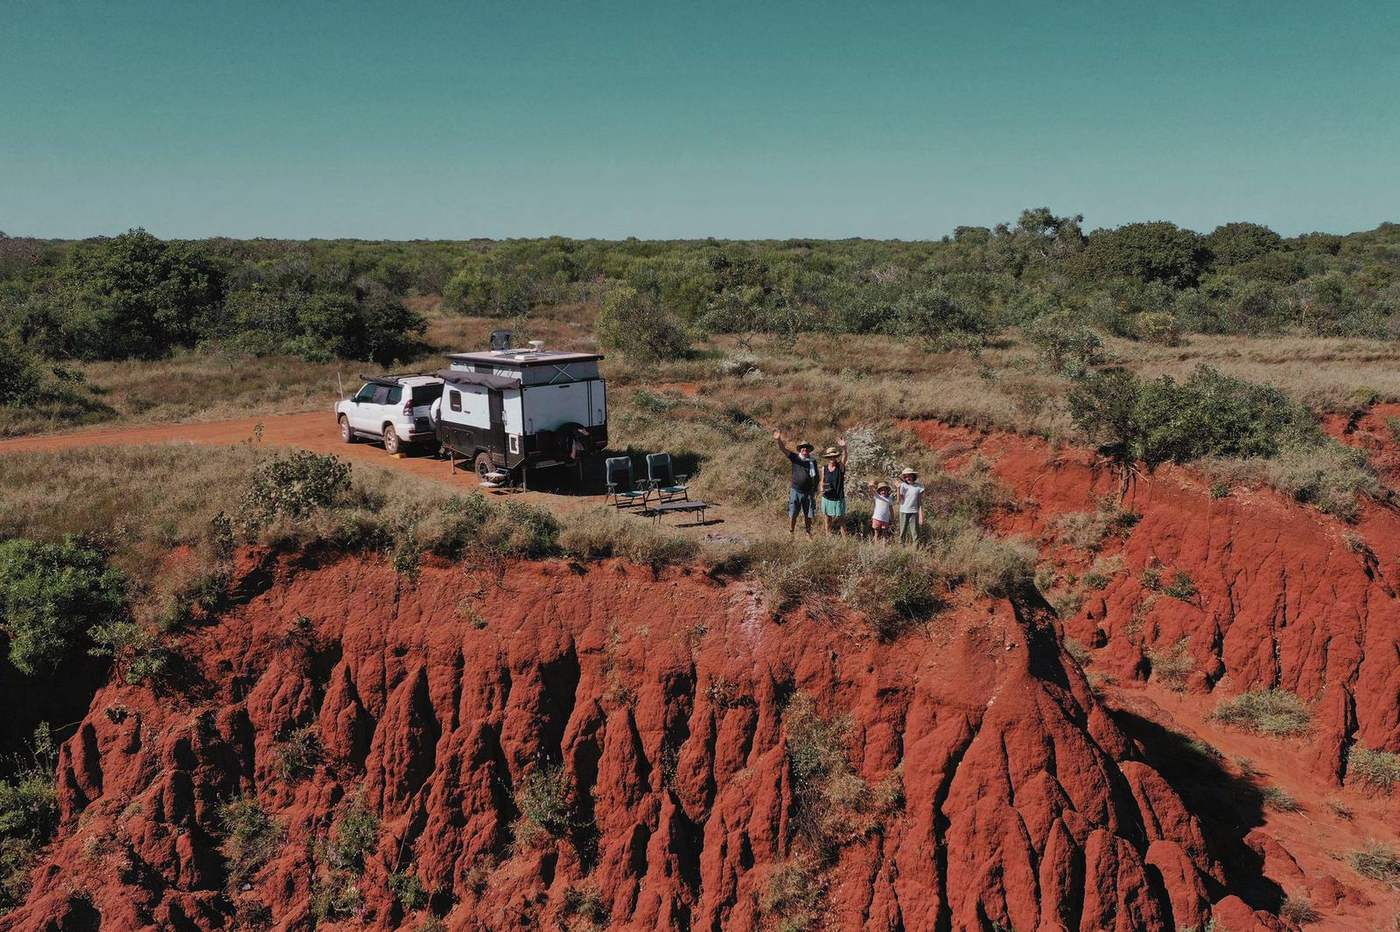
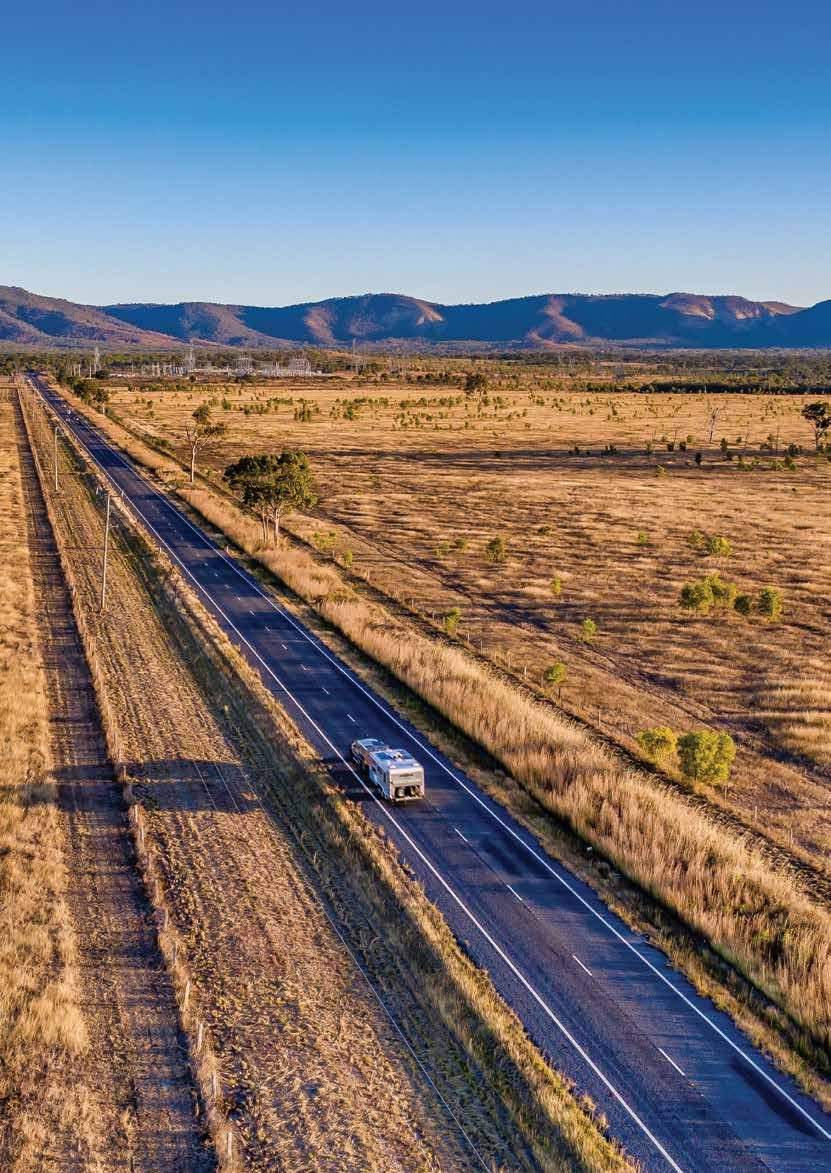
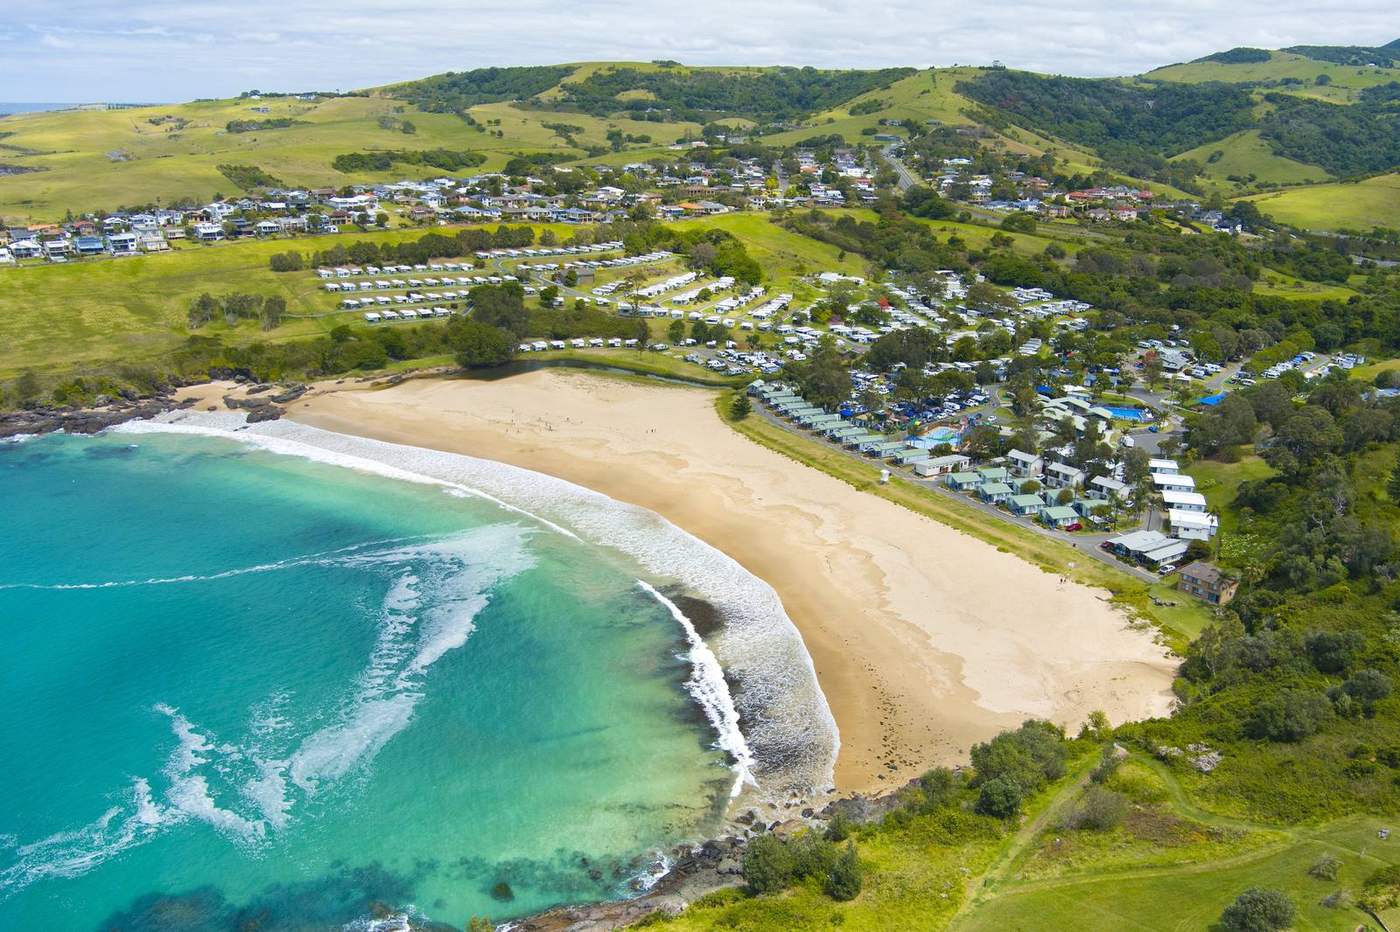
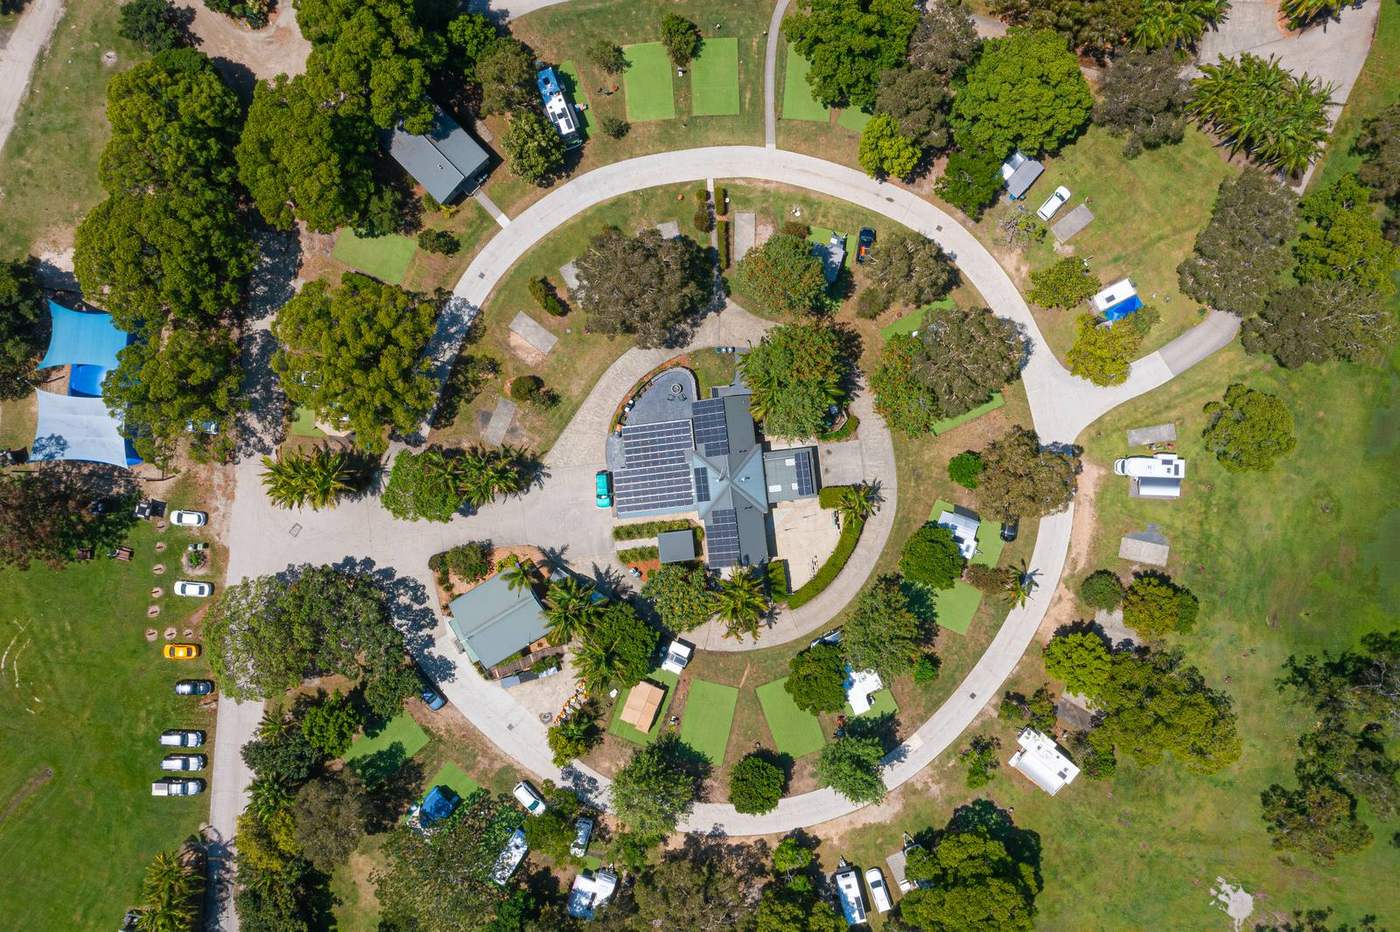
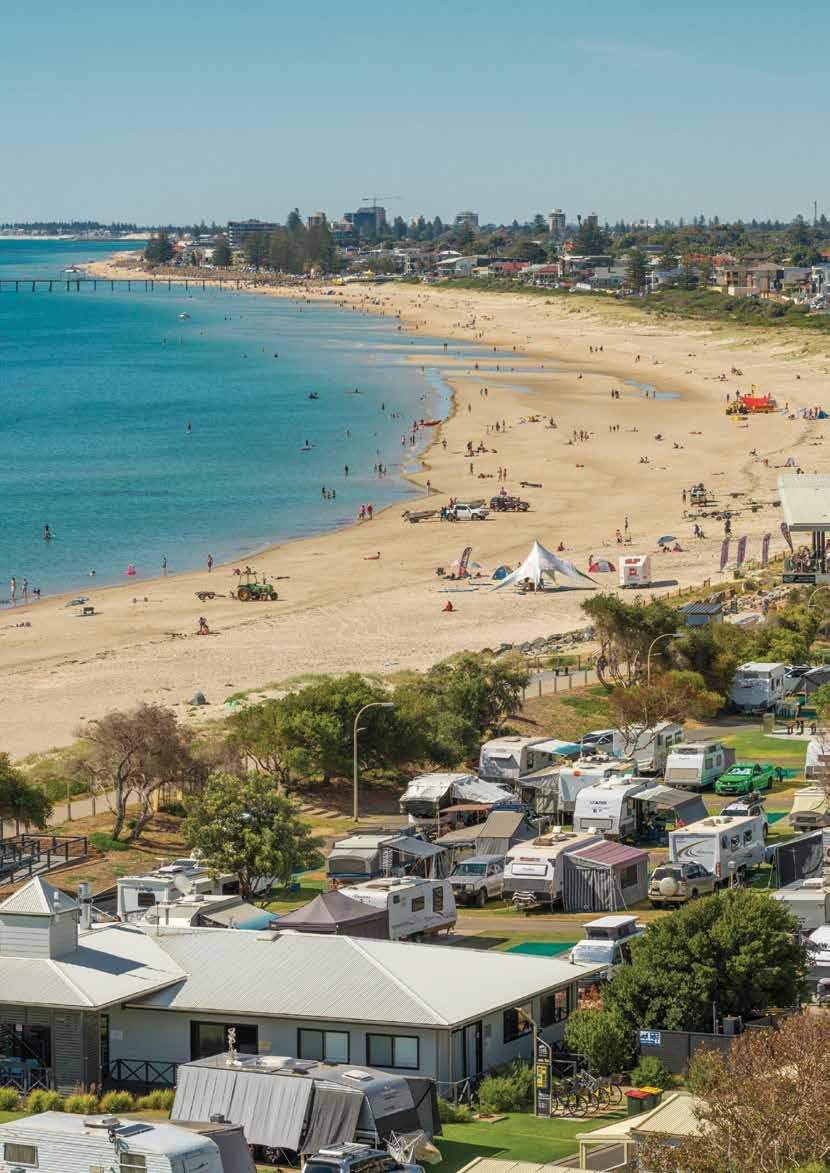
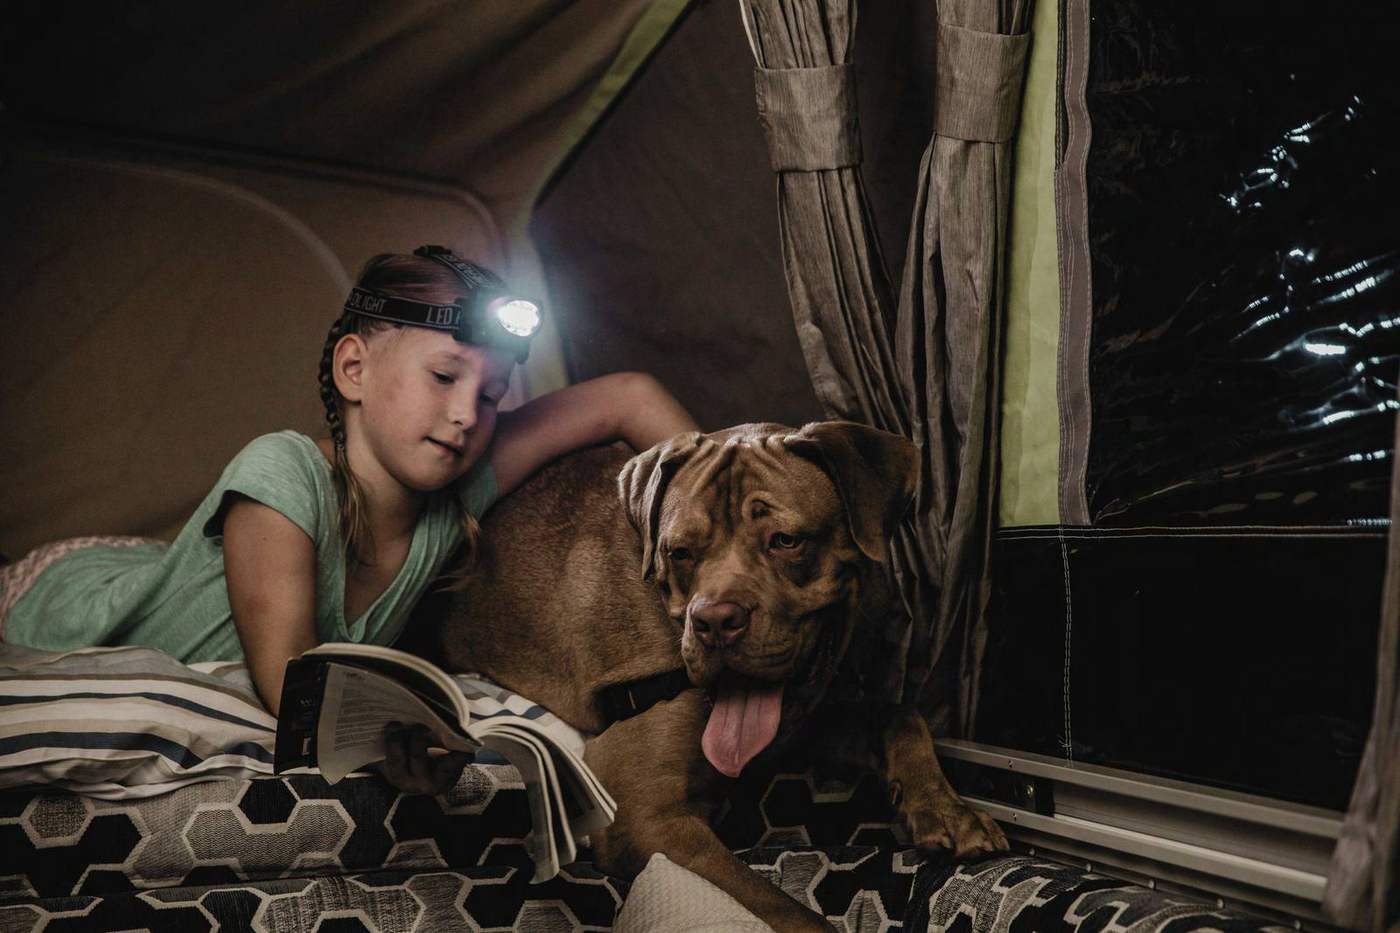
Photographs. The photographs behind the dots are from Caravan Industry Association of Australia reports and are used with permission.  They set the scene and do not show the places or figures named at each stop.

How to read the dots. The orange dot is a single caravan throughout.  At some stops the dots form a picture of the subject, such as a key for a vehicle entering the market, a caravan, a house, a map of Australia, a moon for nights or a cabin for caravan parks.  The picture is decoration: only the number and colour of the dots carry information.  The key at the Market stop is drawn after the RVMAP accreditation key.  It does not mean that every vehicle counted there is RVMAP accredited.  The other dots change meaning at each step, and the scale is shown at the top of the screen each time.  Dot counts are rounded to the nearest whole dot, so a group can differ slightly from its exact figure.

Australian-made and international product. The Register of Approved Vehicles records vehicles approved for supply to the Australian market, whether made in Australia or internationally.  It is a measure of market entry, not a factory production count.  The Australian-made figure comes from manufacturers' production reports.  The international figure comes from Australian Bureau of Statistics trade data and includes related components as well as complete caravan trailers.  The two are not directly comparable.

Shares of all travel. The shares of trips, nights and spending are calculated by dividing the caravan and camping figure by the national figure.  Both come from Tourism Research Australia's Domestic Tourism Statistics for 2025.  The 87 per cent regional figure is for caravan and camping trips.

Households and people. The household and population ratios divide the national totals by the number of registered recreational vehicles.  They do not mean that one household in 11 owns one: some households own more than one, and some vehicles are owned by businesses such as hire fleets.  The household figure is a projection for June 2026, the population figure is for March 2026 and the registrations are for January 2026.

Vehicle comparisons. The comparison with motorcycles, trucks and buses uses January 2025 figures for every vehicle type, because that is the latest year for which all are to hand.  Recreational vehicles are counted separately from registered motor vehicles, because most are towed.

Jobs and gross domestic product. These figures come from input-output modelling by BDO EconSearch for 2020-21, a year affected by COVID-19 restrictions.  They cover commercial caravan parks and the spending of people staying in them.  They do not cover manufacturing, retail, or camping outside caravan parks.  Flow-on figures include activity in supplying industries and spending by employees.  The comparison with the Australian Bureau of Statistics tourism figures uses the same year, but the two estimates are produced by different methods, and the Bureau counts people employed, not jobs.

Economic impact. The report does not publish how the $27.1 billion divides between caravan parks, manufacturing and trade, and visitor expenditure, or the method used to estimate it.  Farm production and tourism gross domestic product are measured differently and cover different years.  They are shown to give a sense of scale and should not be read as like-for-like comparisons.

States and postcodes. Registrations are allocated to states by postcode range.  New South Wales and the Australian Capital Territory are combined because some postcodes cross the border.  State trip figures add to more than the national total.  Locality names for postcodes are indicative.

Different periods. The figures cover different periods and should not be added together.

Questions about the research: [email protected]

Drawn from Caravan and Camping State of Industry 2026, RV Production IQ (September 2026), a customised extract of Road Vehicles Australia (January 2026), Caravan and Camping Consumer Sentiment (September 2026) and the BDO study of the caravan park industry in 2020-21, with comparison figures from the sources listed above.

© 2026 Caravan Industry Association of Australia.